Guides
Medical courier route density: how many stops per mile make an account profitable
Stops per mile and stops per hour decide whether a specimen account pays. Here is the density math, a worked example, and the classification costs behind it.
What to take away
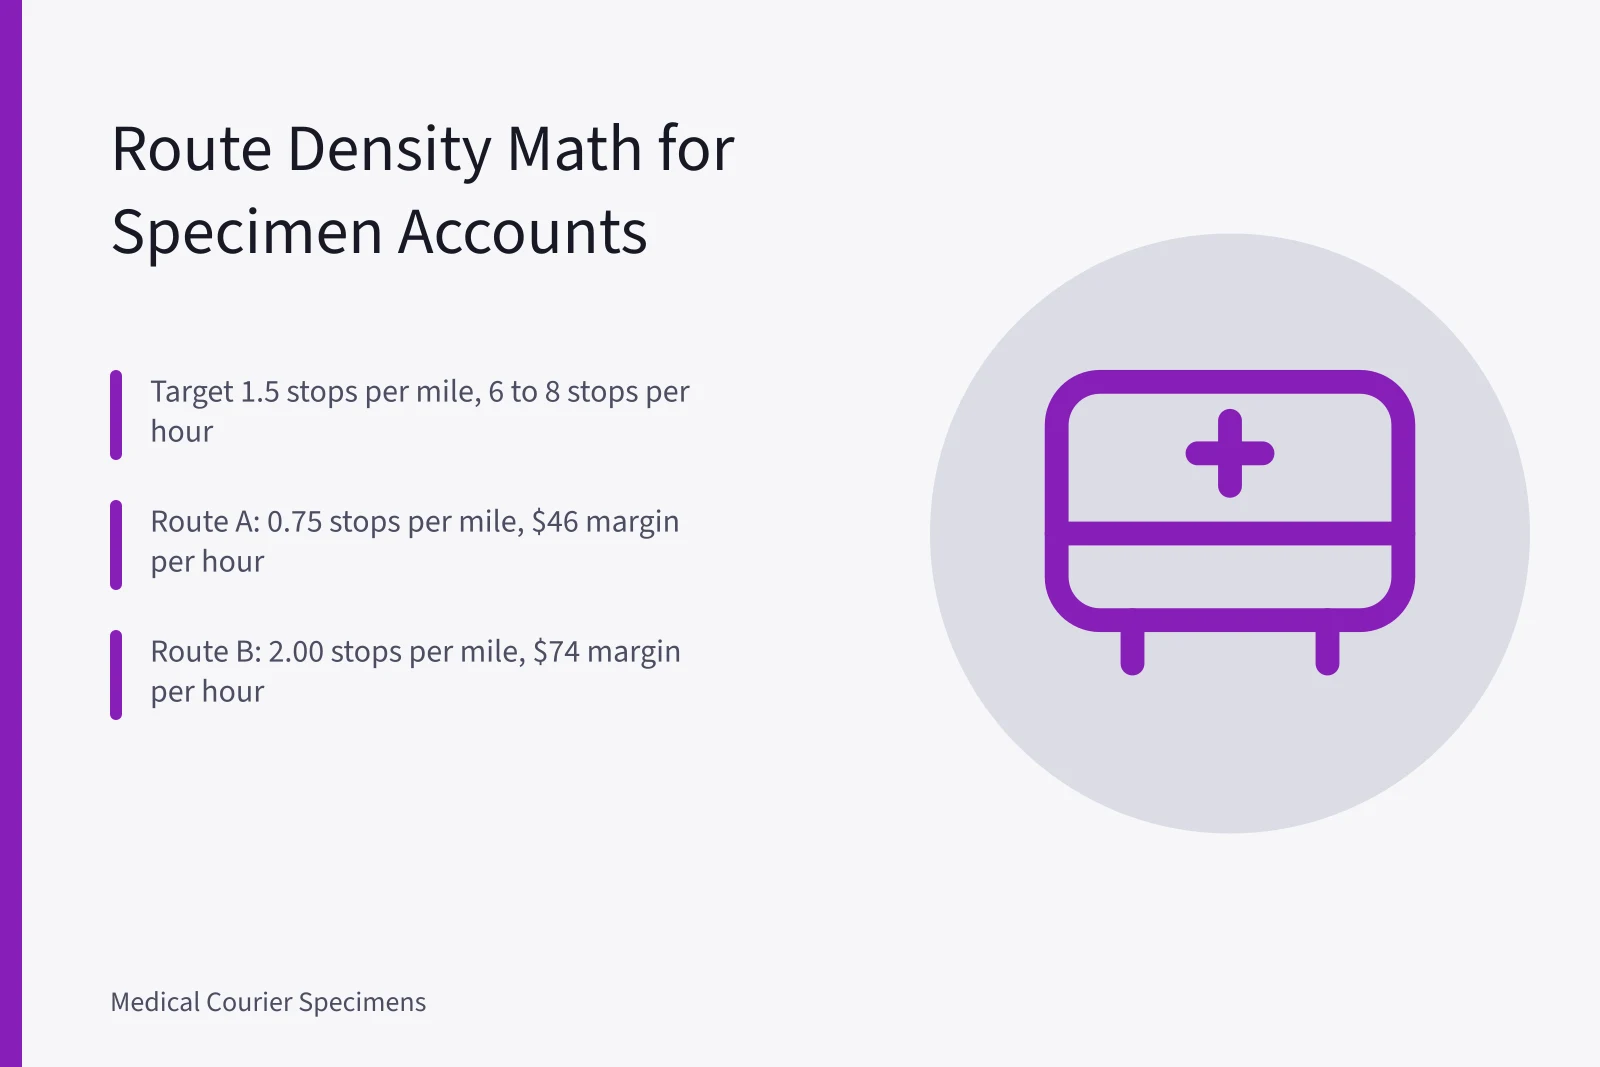
- Route density decides whether a specimen account pays, often before the rate per stop does. Target roughly 1.5 stops per mile and 6 to 8 stops per hour on a scheduled loop.
- Stops per mile sets cost per stop. Stops per hour sets gross per hour. Both numbers belong in the decision to sign.
- The same stop count over different geography can differ by $25 or more in margin per hour, as the worked example shows.
- Driver classification raises or lowers the density floor, because hourly employees and per stop contractors absorb slow miles differently.
- Density shifts with demand. A corridor that gains specimen volume next year will support a route that fails today.
Why stops per mile beats stops per hour
A route that collects 30 specimens across 10 miles runs at 3 stops per mile. The same 30 stops spread across 40 miles runs at 0.75. A rate card that pays per stop cannot tell those two routes apart.
Stops per hour measures driver time. Stops per mile measures vehicle cost, drive time, and the geography between stops. A rural loop can post respectable stops per hour while burning miles between small towns.
Density is also a moving target. Corridors gain and lose specimen volume as labs open, close, or consolidate, and the medical courier demand signals worth tracking are the ones that push stops closer together.
The route density formula and its thresholds
Work the numbers in this order before you quote a rate.
- Time the full loop door to door, including parking, entry, specimen pickup, and paperwork.
- Divide total stops by route miles to get stops per mile.
- Divide total stops by clock hours to get stops per hour.
- Multiply stops by the per stop rate, then subtract vehicle cost per mile and driver cost per hour.
As a working rule, a scheduled specimen loop below 1.0 stop per mile rarely covers its own drive time at common per stop rates. Loops at 1.5 stops per mile and above leave room for a locked door or a late STAT pickup.
Density below 1.0 stop per mile means you are selling drive time and labeling it a courier account.
Example: two specimen accounts with the same stop count
Both routes here pay $11 per stop and serve 24 stops per day.
| Measure | Route A | Route B |
|---|---|---|
| Stops | 24 | 24 |
| Route miles | 32 | 12 |
| Stops per mile | 0.75 | 2.00 |
| Clock hours | 3.7 | 2.7 |
| Stops per hour | 6.5 | 8.8 |
| Stop revenue | $264 | $264 |
| Vehicle cost at $0.70 per mile | $22 | $8 |
| Driver pay at $20 per hour | $73 | $54 |
| Margin per hour | $46 | $74 |
Route A spends 80 minutes driving and 120 minutes at stops. Route B spends 28 minutes driving on the same stop count. The gap comes from geography, not from effort.
The $0.70 per mile figure is a placeholder for your own all-in vehicle cost. If you claim the standard mileage rate instead, IRS records for mileage claims show the documentation that holds up.
Stop time, specimen handling, and cold chain packaging
Dwell time is the quiet half of density. Every stop carries a fixed handling cost: check in, scan, sign, secure the bag, return to the vehicle.
Specimens that need validated cold chain packaging add minutes at each stop, and those minutes land in the denominator of stops per hour. A 24 stop route with 8 minute dwell times loses about 48 minutes against a 5 minute baseline.
Dense routes hide that cost better, because short drive legs leave room to absorb it.
Contract terms that change the density floor
Not every stop deserves a signature. Access to hospital and lab work usually runs through a business associate agreement, and its terms shape how much handling time each stop requires.
Waiting time clauses, fuel surcharge formulas, and STAT escalation rules also move the floor. A route that clears 1.5 stops per mile can fail once unpaid waiting is added back.
Density, driver classification, and cost per stop
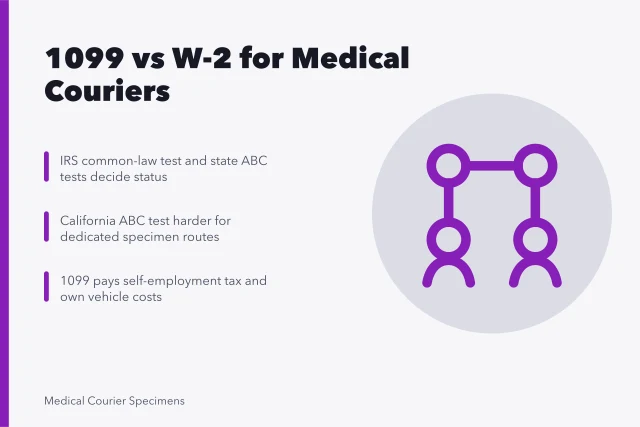
Pay structure interacts directly with density. An hourly employee costs the same on a 3 hour route and a 5 hour route, which makes thin routes expensive to staff. A per stop contractor absorbs slow miles, but only if the working relationship survives 1099 vs W-2 driver classification.
For owner-operators that is the real fork. The IRS common-law factors and state ABC tests decide whether per stop pay is defensible, and the answer differs by state.
Where employee status applies, payroll taxes, workers compensation, and scheduled hours can push your break even density up by a full stop per hour. Per stop pay also means a Form 1099-NEC at year end.
Demand signals that change your minimum density
Density is not a fixed property of a zip code. Lab consolidations move draw sites. Home collection growth scatters stops. Hospital system contracts cluster them.
Before you commit to a route, ask which of the 2027 demand signals touches your corridor. A courier who expects a volume shift can price the next contract against the density it will have, not the density it has now.